
Increased working from home will affect commuting patterns
- Tags
- Working from home
What does the image show?
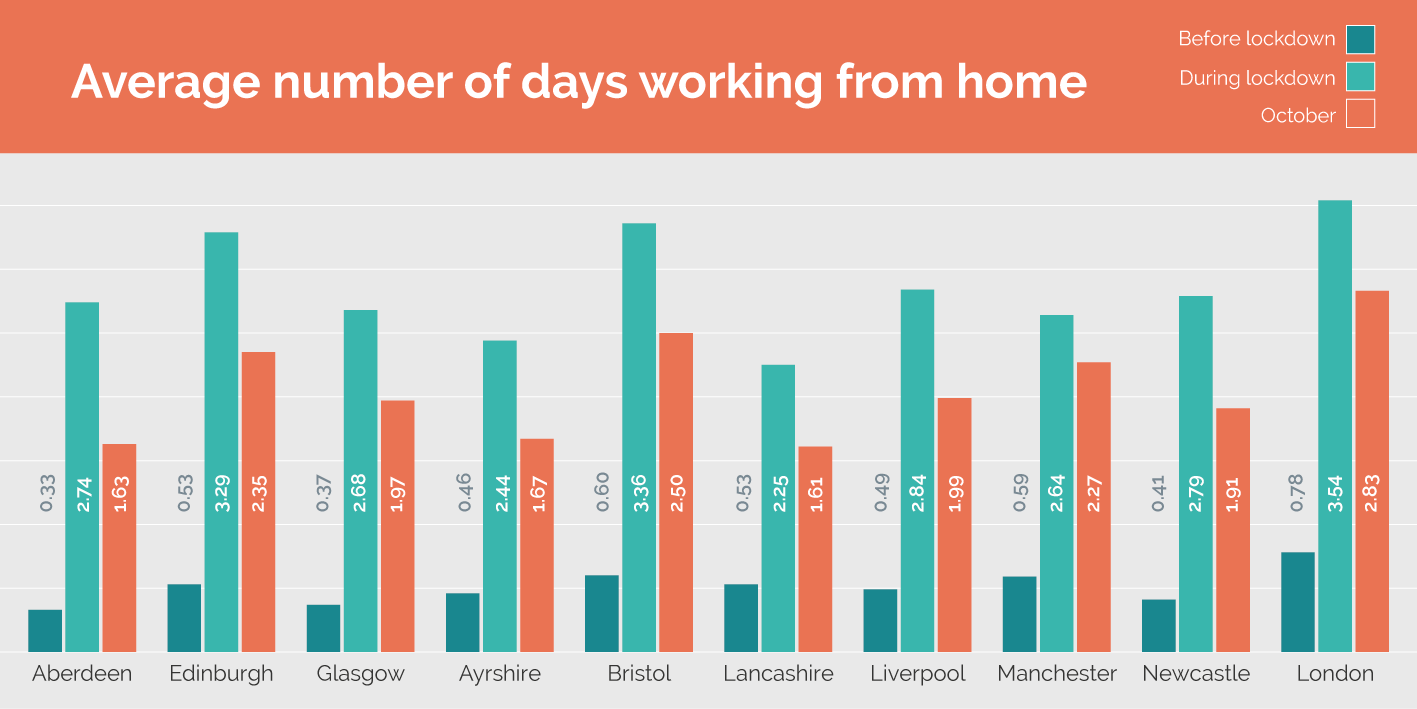
The chart shows the average number of days worked from home by respondents in each of our survey sites. The data shows very significant increases from pre-pandemic levels where London was the highest with an average of 0.78 days per week. In June 2020 this was as high as 3.54 in London and 3.36 in Bristol. By October, the levels had fallen back somewhat but still remain well above pre-pandemic levels.
Why is this important?
It is well understood that it is easier for employees in some industries to work from home. Different places have different industrial structures and therefore are seeing quite different work from home behaviours. This was true before the pandemic but the scale of difference was not so visible.
As the economy opens up people who have been working from home will start to go back to work more often. However, there will be reductions in commuting and this will impact on the viability of public transport. It seems likely that the return to work will also be uneven across places. This may mean different levels of support are required to maintain service frequencies and fares as travel patterns adjust.
Figure: Average number of days working from home. All working participants not on furlough regardless of number of days worked; weighted; N= 5,418 (Before), 3,772 (During), 3,074 (October).